Intepretation#
import numpy as np
import pandas as pd
import statsmodels.api as sm
from sklearn.linear_model import LogisticRegression
import seaborn as sns
import patsy
sns.set(rc={'figure.figsize':(11.7,8.27)})
Fake Data Example: President Support#
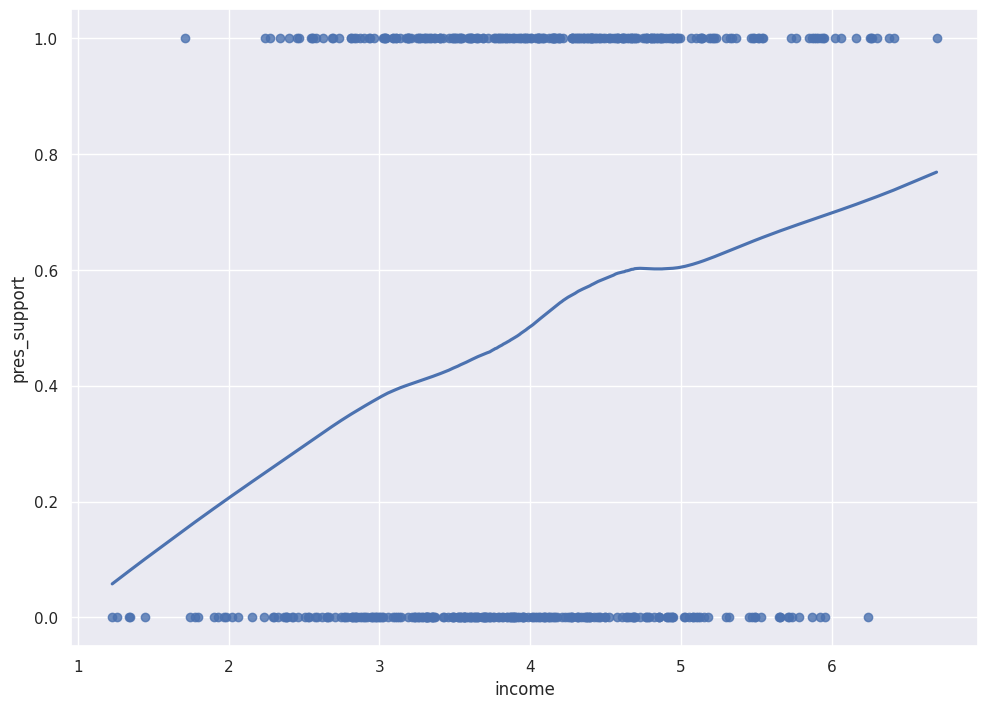
Suppose we have the data below, where income is the independent variable (in 10,000s). The dependent variable is a binary variable, indicating presidential support.
def inverse_logit(x):
    return(1 / (1 + np.exp(-x)))

n = 500
np.random.seed(0)
df = pd.DataFrame({
    "income":np.random.normal(4,1,n)
})

df["Z"] = -1.4 + 0.33*df["income"]
df["probs"] = inverse_logit(df["Z"])
df["pres_support"] = np.random.binomial(size=n, n=1, p=df["probs"])
df["pres_support"].value_counts()

sns.regplot(df["income"], df["pres_support"], lowess=True)
/home/chansoo/projects/statsbook/.venv/lib/python3.8/site-packages/seaborn/_decorators.py:36: FutureWarning: Pass the following variables as keyword args: x, y. From version 0.12, the only valid positional argument will be `data`, and passing other arguments without an explicit keyword will result in an error or misinterpretation.
  warnings.warn(
<Axes: xlabel='income', ylabel='pres_support'>

f = 'pres_support ~ income'
y, X = patsy.dmatrices(f, df, return_type='dataframe')
mod = sm.Logit(y, X)
res = mod.fit()
res.summary()
Optimization terminated successfully.
         Current function value: 0.666070
         Iterations 5
| Dep. Variable: | pres_support | No. Observations: | 500 |
|---|---|---|---|
| Model: | Logit | Df Residuals: | 498 |
| Method: | MLE | Df Model: | 1 |
| Date: | Thu, 01 Jun 2023 | Pseudo R-squ.: | 0.03896 |
| Time: | 12:45:49 | Log-Likelihood: | -333.03 |
| converged: | True | LL-Null: | -346.54 |
| Covariance Type: | nonrobust | LLR p-value: | 2.029e-07 |
| coef | std err | z | P>|z| | [0.025 | 0.975] | |
|---|---|---|---|---|---|---|
| Intercept | -1.9498 | 0.396 | -4.925 | 0.000 | -2.726 | -1.174 |
| income | 0.4843 | 0.097 | 5.002 | 0.000 | 0.295 | 0.674 |
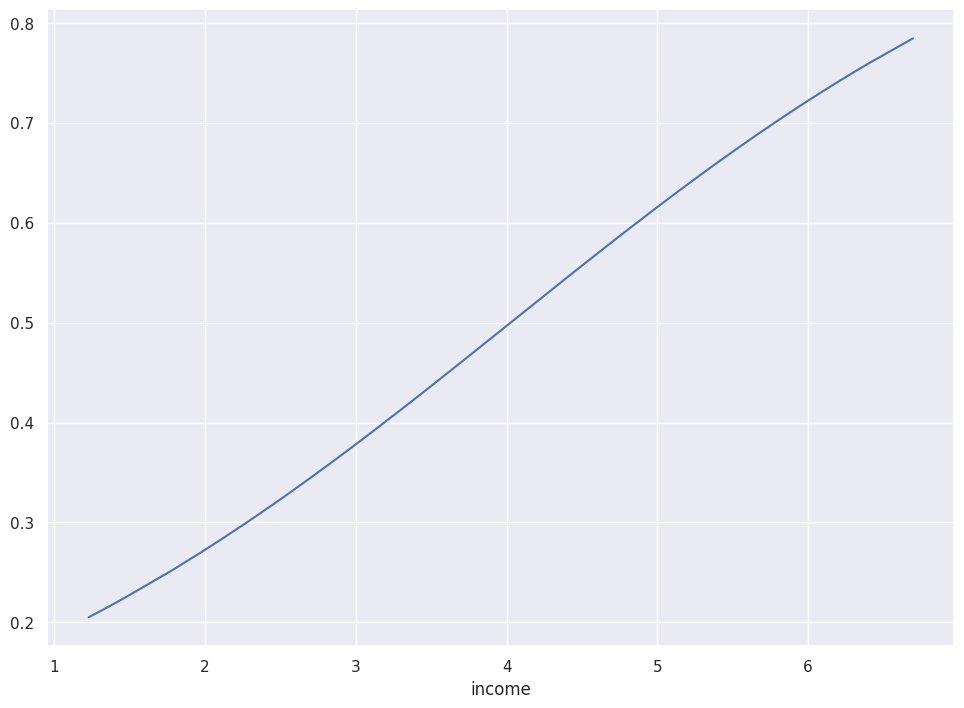
predictions:
sns.lineplot(df["income"], res.predict())
/home/chansoo/projects/statsbook/.venv/lib/python3.8/site-packages/seaborn/_decorators.py:36: FutureWarning: Pass the following variables as keyword args: x, y. From version 0.12, the only valid positional argument will be `data`, and passing other arguments without an explicit keyword will result in an error or misinterpretation.
  warnings.warn(
<Axes: xlabel='income'>

Getting Probabilities#
Just like linear regression, the intercept can be interpreted assuming zero for all other covarites. Here, that would mean income = 0.
print(f"P(pres support) = {inverse_logit(res.params[0])}")
P(pres support) = 0.12457544469619863
For the average income level:
print(f"mean: {np.mean(df['income'])}")
print(f"P(pres support) = {inverse_logit(res.params[0] + res.params[1] * np.mean(df['income']))}")
mean: 3.9746455606675664
P(pres support) = 0.4937388607411525
Intepreting the Coefficient on Income#
Since logistic regression is non-linear, the change in probability associated with a one unit increase in income depends on the income.
x = inverse_logit(res.params[0] + res.params[1] * 2) - inverse_logit(res.params[0] + res.params[1] * 1)
print(f"A one unit increase from 1 to 2 is associated with an increase in P(pres support) of {x}")
A one unit increase from 1 to 2 is associated with an increase in P(pres support) of 0.08501590471118814
x = inverse_logit(res.params[0] + res.params[1] * 4.5) - inverse_logit(res.params[0] + res.params[1] * 3.5)
print(f"A one unit increase from 3.5 to 4.5 is associated with an increase in P(pres support) of {x}")
A one unit increase from 3.5 to 4.5 is associated with an increase in P(pres support) of 0.12047149989311856
x = inverse_logit(res.params[0] + res.params[1] * 6) - inverse_logit(res.params[0] + res.params[1] * 5.5)
print(f"A one unit increase from 5.5 to 6 is associated with an increase in P(pres support) of {x}")
A one unit increase from 5.5 to 6 is associated with an increase in P(pres support) of 0.051069298867425617
Divide by 4 Rule#
The steppest change in probability occurs at P(pres support) = 0.5. The derivative is maximized at this point and attains the value \(\frac{\beta e^0}{(1+e^0)^2} = \frac{\beta}{4}\)
So the maximum difference in Pr(pres support) from a one unit change in income is at most \(\frac{\beta}{4}\).
For convenience, we can divide logistic regression coefficients by 4 to get an upper bound of the predictive difference corresponding to a one unit change in income.
res.params[1] / 4
0.12106435437336137
A one unit change in income is associated with AT MOST a 12.1% increase in pres support.
Odds Ratios:#
Not recommended since confusing…
odds = np.exp(res.params)
odds
Intercept    0.142303
income       1.622969
dtype: float64
print(f"A unit change in income is associated with a multiplicative change of {odds['income']} in the odds")
A unit change in income is associated with a multiplicative change of 1.6229693725926753 in the odds