Applied#
Show code cell content
import warnings
warnings.filterwarnings("ignore")

import pandas as pd
import numpy as np

from sklearn.datasets import make_blobs
from sklearn.cluster import KMeans

import seaborn as sns
sns.set(rc={'figure.figsize':(11.7,8.27)})
import matplotlib
import matplotlib.pyplot as plt
import matplotlib.animation as animation


# sudo apt update
# sudo apt install ffmpeg
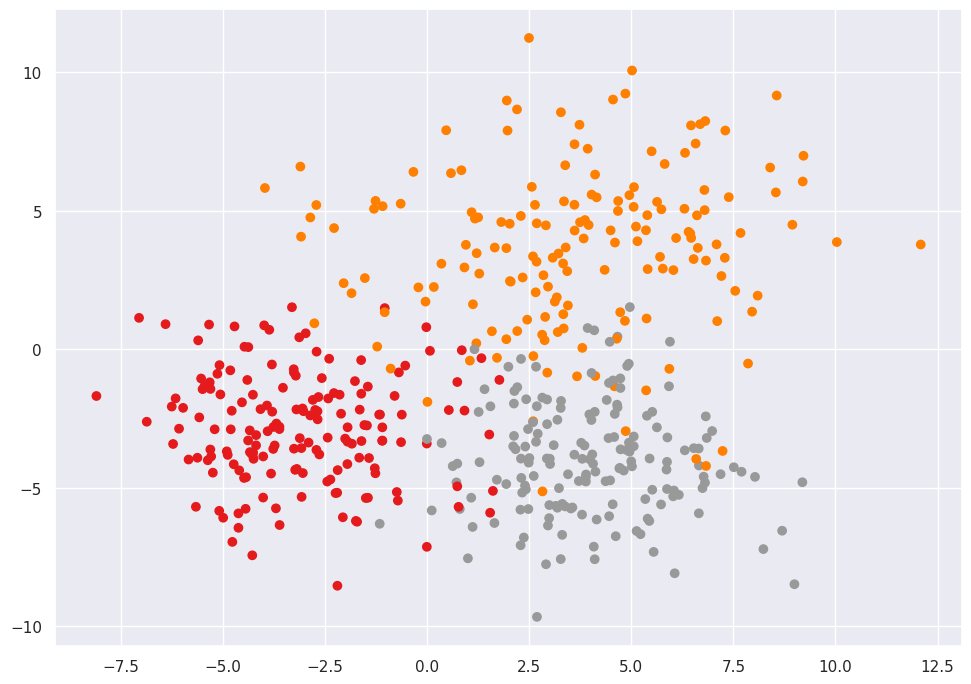
With clustering problems, you don’t have a labelled training set. But for this demo, we generate y for fake data to be able to evaluate results.
centers = [(-3, -3), (4, 4), (4, -4)]
cluster_std = [2, 3, 2]
X, y = make_blobs(
    n_samples=500,
    cluster_std = cluster_std,
    centers = centers,
    n_features = 2,
    random_state=0
)

plt.scatter(X[:,0], X[:,1], c=y, cmap="Set1")
<matplotlib.collections.PathCollection at 0x7fe6205700d0>
Using sklearn#
kmeans = KMeans(n_clusters=3, random_state=0).fit(X)
kmeans.labels_
array([2, 0, 1, 1, 2, 1, 1, 2, 2, 2, 1, 0, 2, 1, 1, 0, 0, 2, 2, 0, 0, 0,
       2, 2, 0, 2, 0, 2, 0, 2, 0, 0, 0, 2, 1, 1, 0, 0, 2, 2, 0, 2, 1, 0,
       2, 2, 0, 0, 1, 2, 2, 0, 0, 0, 0, 2, 1, 1, 1, 2, 2, 1, 0, 0, 2, 1,
       1, 2, 2, 2, 2, 2, 2, 0, 0, 0, 2, 2, 0, 0, 0, 0, 0, 2, 1, 2, 2, 0,
       0, 2, 2, 1, 0, 2, 1, 2, 1, 2, 1, 1, 1, 2, 1, 2, 1, 0, 1, 1, 0, 2,
       2, 2, 0, 2, 2, 2, 2, 0, 1, 1, 0, 2, 2, 2, 1, 2, 2, 1, 2, 0, 0, 0,
       1, 2, 2, 0, 2, 0, 2, 1, 2, 1, 2, 0, 1, 0, 2, 1, 0, 1, 2, 2, 2, 0,
       2, 0, 1, 0, 2, 2, 0, 1, 0, 0, 1, 2, 1, 2, 1, 2, 1, 2, 1, 0, 1, 0,
       2, 2, 0, 2, 1, 0, 1, 2, 0, 1, 2, 0, 0, 2, 2, 2, 2, 2, 0, 2, 2, 0,
       2, 1, 0, 2, 1, 2, 1, 2, 0, 0, 0, 0, 2, 0, 0, 2, 1, 1, 2, 2, 0, 2,
       2, 0, 0, 1, 1, 1, 2, 2, 2, 2, 1, 2, 1, 1, 1, 0, 1, 2, 0, 2, 1, 2,
       0, 2, 2, 1, 2, 2, 1, 2, 0, 0, 1, 0, 1, 0, 2, 0, 2, 1, 1, 1, 1, 0,
       0, 1, 0, 0, 1, 1, 1, 2, 1, 0, 0, 2, 0, 2, 1, 2, 2, 0, 0, 1, 0, 2,
       1, 0, 2, 2, 1, 0, 0, 1, 0, 1, 1, 2, 1, 0, 0, 0, 1, 2, 0, 0, 2, 2,
       1, 2, 0, 1, 1, 0, 2, 1, 0, 1, 2, 1, 2, 0, 2, 0, 2, 1, 1, 1, 0, 0,
       0, 1, 0, 2, 2, 2, 0, 2, 2, 2, 0, 1, 1, 1, 0, 1, 0, 0, 0, 2, 0, 0,
       0, 2, 0, 0, 2, 2, 2, 2, 1, 2, 1, 2, 2, 2, 2, 0, 0, 0, 1, 2, 0, 1,
       0, 1, 0, 1, 2, 2, 0, 2, 1, 0, 1, 2, 2, 0, 1, 2, 1, 2, 0, 0, 0, 1,
       2, 0, 0, 1, 2, 2, 0, 2, 1, 0, 2, 2, 1, 0, 1, 0, 0, 1, 0, 0, 0, 0,
       1, 0, 2, 2, 2, 0, 2, 2, 2, 1, 2, 1, 0, 1, 0, 1, 1, 0, 0, 2, 2, 2,
       0, 0, 1, 2, 0, 2, 1, 0, 0, 1, 1, 2, 1, 2, 1, 1, 1, 1, 2, 0, 2, 1,
       0, 1, 2, 2, 1, 1, 0, 2, 0, 0, 2, 1, 1, 0, 2, 0, 1, 1, 1, 0, 0, 1,
       1, 2, 2, 2, 1, 1, 1, 0, 1, 2, 2, 2, 1, 0, 0, 1], dtype=int32)
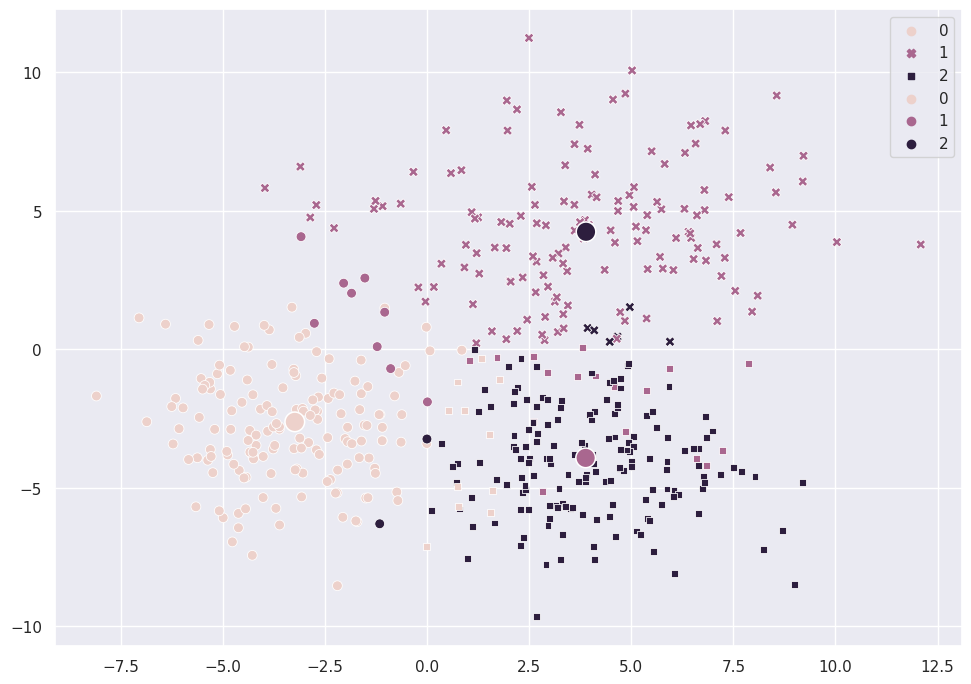
sns.scatterplot(X[:,0], X[:,1], hue=y, style=kmeans.predict(X), s=50)
sns.scatterplot(kmeans.cluster_centers_[:,0], kmeans.cluster_centers_[:,1], hue=[0,2,1], s=200)
<Axes: >