Applied#
from sklearn.cluster import AgglomerativeClustering
from scipy.cluster.hierarchy import dendrogram
from sklearn.datasets import make_blobs

import matplotlib.pyplot as plt
plt.figure(figsize=(16, 14), dpi=80)
import numpy as np

centers = [(-3, -3), (4, 4), (4, -4)]
cluster_std = [2, 3, 2]
X, y = make_blobs(
    n_samples=500,
    cluster_std = cluster_std,
    centers = centers,
    n_features = 2,
    random_state=0
)

# https://scikit-learn.org/stable/auto_examples/cluster/plot_agglomerative_dendrogram.html#sphx-glr-auto-examples-cluster-plot-agglomerative-dendrogram-py
def plot_dendrogram(model, **kwargs):
    # Create linkage matrix and then plot the dendrogram

    # create the counts of samples under each node
    counts = np.zeros(model.children_.shape[0])
    n_samples = len(model.labels_)
    for i, merge in enumerate(model.children_):
        current_count = 0
        for child_idx in merge:
            if child_idx < n_samples:
                current_count += 1  # leaf node
            else:
                current_count += counts[child_idx - n_samples]
        counts[i] = current_count

    linkage_matrix = np.column_stack(
        [model.children_, model.distances_, counts]
    ).astype(float)

    # Plot the corresponding dendrogram
    plt.figure()
    dendrogram(linkage_matrix, **kwargs)
<Figure size 1280x1120 with 0 Axes>
Using sklearn#
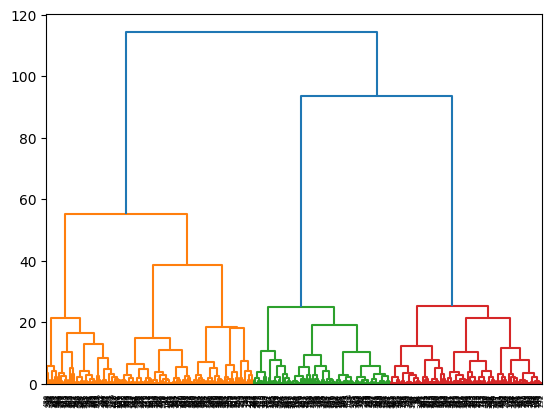
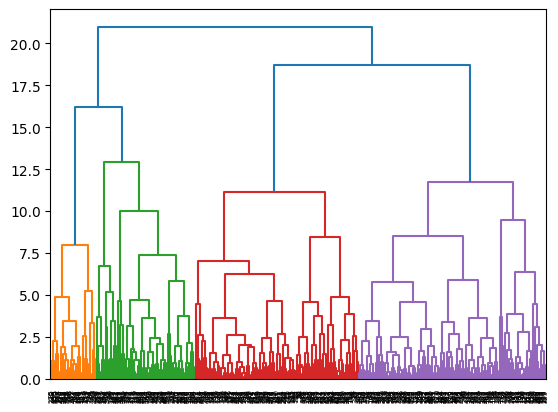
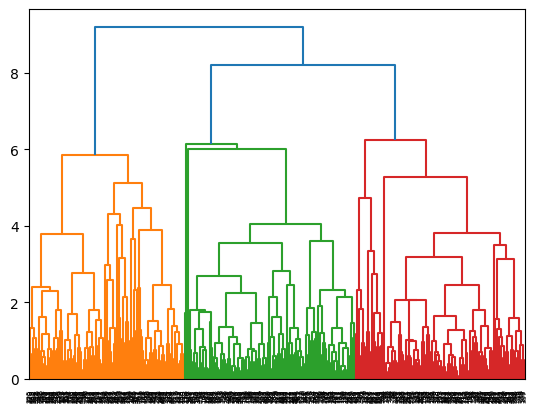
for i,linkage in enumerate(['ward', 'complete', 'average']):
    cluster = AgglomerativeClustering(
        linkage=linkage,
        distance_threshold=0,
        n_clusters=None
    )
    cluster = cluster.fit(X)
    plot_dendrogram(cluster)