Demo#
A poisson regression is used to model counts and/or rates. A count is zero or any positive integer, such as the number of events, the number of students, etc.
A poisson regression (log-linear model) uses a log link function to relate the linear component (\(\eta\)) to the \((0,\infty)\) count variable, e.g. (0,1,2…)
To model rates, we include an “offset” term:
Then Y follows a Poisson distribution parameterized by \(\mu\):
import numpy as np
import pandas as pd
import statsmodels.api as sm
import seaborn as sns
import patsy
sns.set(rc={'figure.figsize':(11.7,8.27)})
Generate Fake Data#
We generate two independent variables x1 and x2. We let \(\eta\) be the linear component, \(X\beta\).
To get \(\mu\), we exponentiate both sides of \(log(\mu) = \eta\), so we have \(\mu = exp(\eta)\)
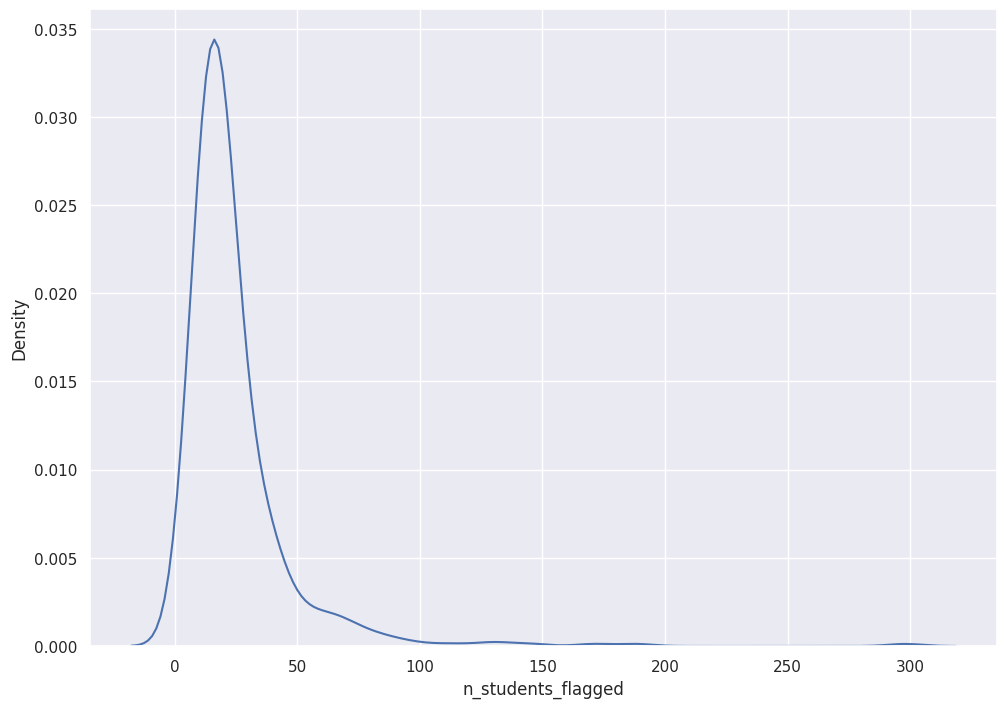
Then y (# of students flagged) is poisson distributed, with its single parameter: \(\mu\).
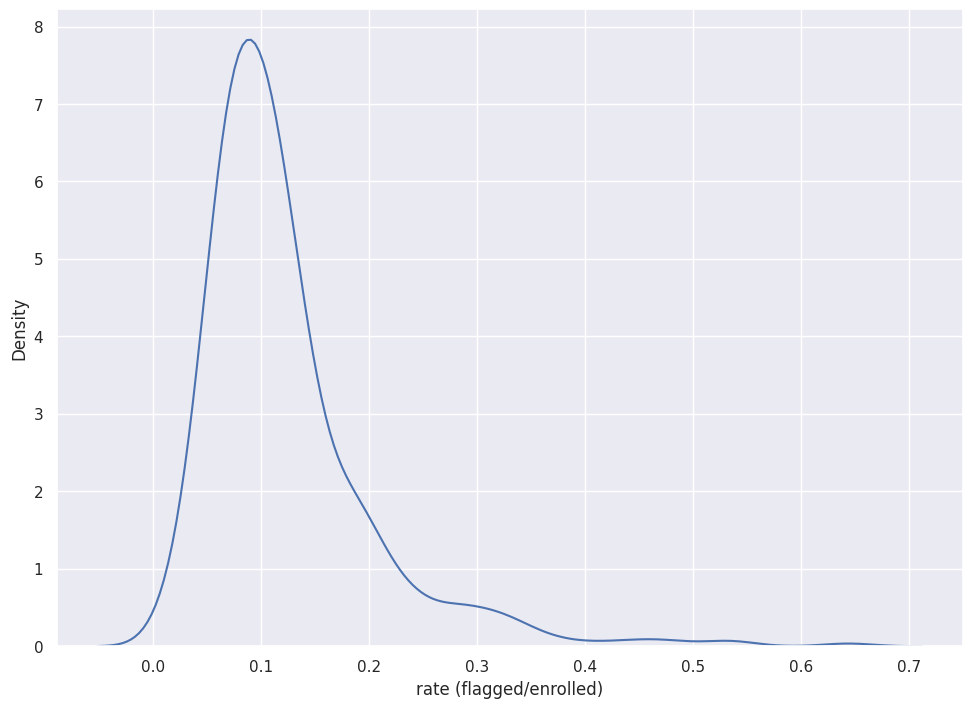
To demonstrate poisson modeling with rates, we create an offset term: n_enrolled, which is simply n_student_flagged plus a random positive integer.
n = 500
np.random.seed(0)
df = pd.DataFrame({
    "x1":np.random.exponential(2,n),
    "x2":np.random.normal(2,1,n),
})

eta = np.exp(2 + 0.25*df["x1"] + 0.25*df["x2"])
df["n_students_flagged"] = np.random.poisson(lam=eta)
df["n_students_flagged"].value_counts()
df["n_enrolled"] = np.round(df["n_students_flagged"],0) + np.random.binomial(200,0.8,n)
sns.kdeplot(df["n_students_flagged"])
<Axes: xlabel='n_students_flagged', ylabel='Density'>
g = sns.kdeplot(df["n_students_flagged"]/df["n_enrolled"])
g.set_xlabel("rate (flagged/enrolled)")
Text(0.5, 0, 'rate (flagged/enrolled)')
f = 'n_students_flagged ~ x1 + x2'
y, X = patsy.dmatrices(f, df, return_type='dataframe')
Statsmodels#
mod = sm.GLM(y, X, family=sm.families.Poisson())
res2 = mod.fit()
print(res2.summary())
                 Generalized Linear Model Regression Results
==============================================================================
Dep. Variable:     n_students_flagged   No. Observations:                  500
Model:                            GLM   Df Residuals:                      497
Model Family:                 Poisson   Df Model:                            2
Link Function:                    Log   Scale:                          1.0000
Method:                          IRLS   Log-Likelihood:                -1486.9
Date:                Thu, 01 Jun 2023   Deviance:                       571.92
Time:                        12:45:56   Pearson chi2:                     563.
No. Iterations:                     5   Pseudo R-squ. (CS):              1.000
Covariance Type:            nonrobust
==============================================================================
                 coef    std err          z      P>|z|      [0.025      0.975]
------------------------------------------------------------------------------
Intercept      2.0270      0.025     79.737      0.000       1.977       2.077
x1             0.2469      0.003     86.086      0.000       0.241       0.253
x2             0.2447      0.010     25.097      0.000       0.226       0.264
==============================================================================
using n_enrolled as offset to model rate (flagged out of enrolled) instead of count (# enrolled)
including an offset is equivalent to including the offset as another pedictor, except with the coefficient fixed to 1.
mod = sm.GLM(y, X, offset=df["n_enrolled"], family=sm.families.Poisson())
res2 = mod.fit()
print(res2.summary())
                 Generalized Linear Model Regression Results
==============================================================================
Dep. Variable:     n_students_flagged   No. Observations:                  500
Model:                            GLM   Df Residuals:                      497
Model Family:                 Poisson   Df Model:                            2
Link Function:                    Log   Scale:                          1.0000
Method:                          IRLS   Log-Likelihood:            -2.5985e+35
Date:                Thu, 01 Jun 2023   Deviance:                   5.1970e+35
Time:                        12:45:56   Pearson chi2:                 2.68e+37
No. Iterations:                   100   Pseudo R-squ. (CS):                nan
Covariance Type:            nonrobust
==============================================================================
                 coef    std err          z      P>|z|      [0.025      0.975]
------------------------------------------------------------------------------
Intercept    -99.7842   2.52e-18  -3.97e+19      0.000     -99.784     -99.784
x1           -24.1414   2.02e-17  -1.19e+18      0.000     -24.141     -24.141
x2            -2.5238   4.29e-18  -5.88e+17      0.000      -2.524      -2.524
==============================================================================
/home/chansoo/projects/statsbook/.venv/lib/python3.8/site-packages/statsmodels/genmod/families/family.py:132: RuntimeWarning: divide by zero encountered in divide
  return 1. / (self.link.deriv(mu)**2 * self.variance(mu))