Theory#
Optimization Problem#
The goal is to maximize within-cluster similarity, or equivalently, minimizing the within-cluster variation:
where W(.) is a measure, most commonly Euclidean distance:
where \(|C_k|\) denotes the number of observations in the \(k\)th cluster and \(p\) is the number of features.
Algorithm#
K-means just requires \(k\), the number of clusters, as an input. There are few variations of the algorithm and different distance measures can be used. The following is one example:
The algorithm uses the following steps:
Randomly initialize all points to one of \(k\) clusters.
Compute the centroids of each cluster.
Assign all points to the cluster whose centroid is closest
Repeat steps 2 and 3 until convergence, i.e. fewer than X% of points are re-assigned clusters at step 3.
Note that this algorithm finds a local, rather than global, minimum. So may be sensitive to the random initialization. So make sure to run the algorithm multiple times.
Show code cell content
import warnings
warnings.filterwarnings("ignore")

import pandas as pd
import numpy as np

from sklearn.datasets import make_blobs

import seaborn as sns
sns.set(rc={'figure.figsize':(11.7,8.27)})
import matplotlib.pyplot as plt

centers = [(-3, -3), (4, 4), (4, -4)]
cluster_std = [2, 3, 2]
X, y = make_blobs(
    n_samples=500,
    cluster_std = cluster_std,
    centers = centers,
    n_features = 2,
    random_state=0
)
Run Manually for Demonstration#
class KmeansDemo:

    def __init__(self, X, K):
        self.X = X
        self.K = K
        self.n = len(self.X)
        self.distances = []
        self.clusters = {0:np.random.choice(self.K, self.n)}
        self.centroids = {}

    def get_centroids(self, clusters):
        return np.array([
            self.X[clusters==k].mean(axis=0)
            for k in range(self.K)
        ])

    def get_clusters(self, centroids):
        distances = np.linalg.norm(
            self.X[:,None,:] - centroids[None,:,:],
            axis=-1
        )
        return np.argmin(distances, axis=1)

    def __call__(self):
        self.centroids[0] = self.get_centroids(self.clusters[0])

        # save each iter for plotting
        for iter in range(1, 15):
            self.clusters[iter] = self.get_clusters(self.centroids[iter-1])
            self.centroids[iter] = self.get_centroids(self.clusters[iter])
            update = np.mean(mod.clusters[iter-1]!=mod.clusters[iter])
            print(iter, update)
            if update < 0.002:
                break
Prints iteration and percentage of points updated. Stops when no new points are updated.
mod = KmeansDemo(X=X, K=3)
mod()
1 0.65
2 0.066
3 0.022
4 0.002
5 0.002
6 0.002
7 0.002
8 0.0
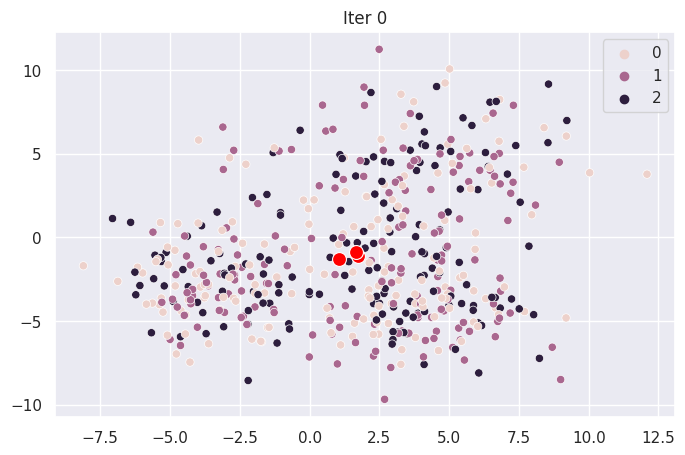
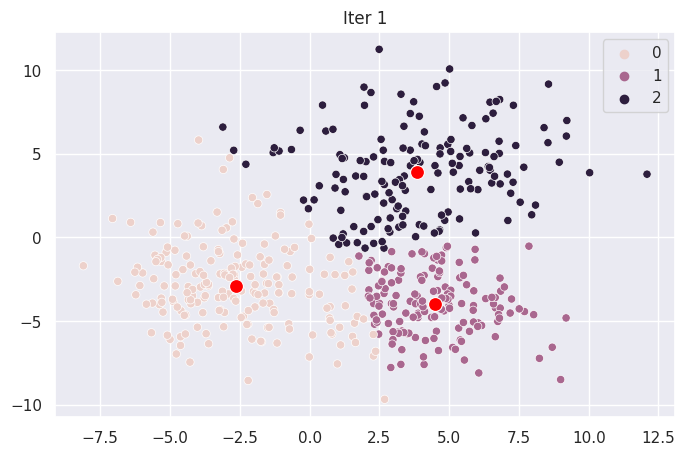
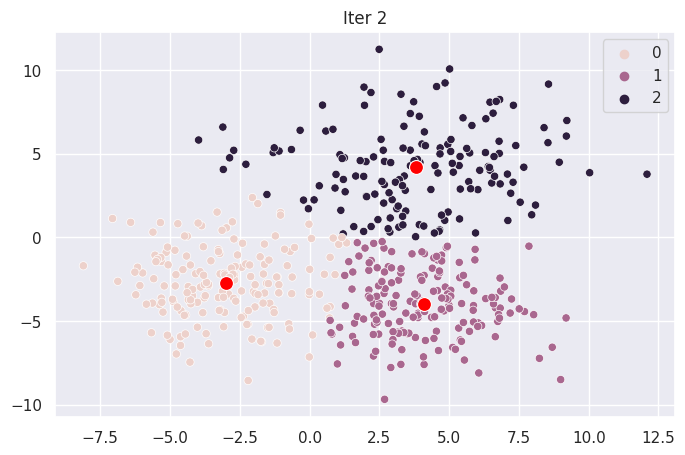
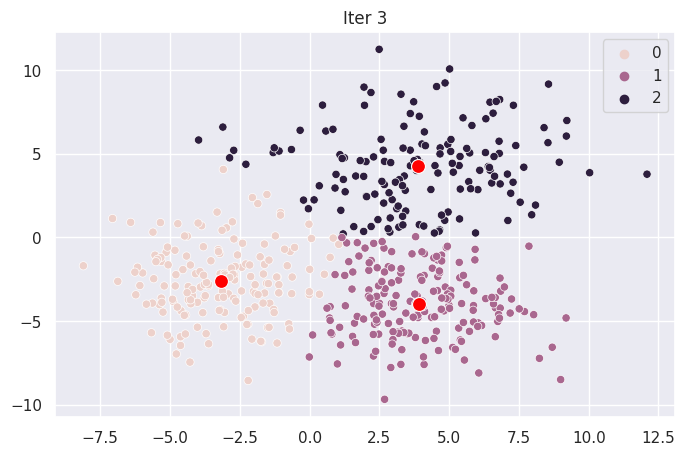
Graph Each Iteration#
color_dict =  {0:"red", 1:"green", 2:"purple"}

sns.set(rc={'figure.figsize':(8,5)})

def plot_iter(i):

    fig = plt.figure(i)
    ax = sns.scatterplot(X[:,0], X[:,1], hue=mod.clusters[i])
    sns.scatterplot(mod.centroids[i][:,0], mod.centroids[i][:,1], color="red", s=100)
    ax.set_title(f"Iter {i}")

for _ in range(len(mod.centroids)):
    plot_iter(_)